Did you ever wonder how to debug a microcontroller? With a Raspberry Pi Pico there's a simple solution: Use another Raspberry Pi Pico 😉!
What I worked on today is being able to prepare two Raspberry Pi Picos (one W and one without W) to debug executables. The one without Wifi will be used as a Picoprobe, the WiFi version as target later.
Prerequisites
- if not already done, install Homebrew
- install a serial terminal. My recommendation is CoolTerm
Building openocd
In Raspberry Pi Pico's Getting Started Document, they have a great explanation of how to build openocd (which is an open sourced on-chip debugger) and picoprobe. I will note down the Mac commands here, if you are on a different system please consult the linked Document:
# install dependencies
brew install libtool automake libusb wget pkg-config gcc texinfo
# create a pico directory whereever you like and navigate there
mkdir -p ~/pico
# clone openocd
git clone https://github.com/raspberrypi/openocd.git --branch rp2040 --depth=1
cd openocd
# export tex path
export PATH="/usr/local/opt/texinfo/bin:$PATH"`
# run bootstrapping script
./bootstrap
# run config script
./configure --disable-werror
# build
make -j4
# test
src/openocd
You should see this output:
Open On-Chip Debugger 0.10.0+dev-gc231502-dirty (2020-10-15-07:48)
Licensed under GNU GPL v2
For bug reports, read
http://openocd.org/doc/doxygen/bugs.html
embedded:startup.tcl:56: Error: Can't find openocd.cfg
in procedure 'script'
at file "embedded:startup.tcl", line 56
Info : Listening on port 6666 for tcl connections
Info : Listening on port 4444 for telnet connections
Error: Debug Adapter has to be specified, see "interface" command
embedded:startup.tcl:56: Error:
in procedure 'script'
at file "embedded:startup.tcl", line 56
It works? Good!
Download and setup pico-sdk
# navigate back to your pico directory
# clone picoprobe and install submodules
git clone https://github.com/raspberrypi/pico-sdk.git
cd pico-sdk
git submodule update --init
Building picoprobe
# navigate back to your pico directory
# clone picoprobe and install submodules
git clone https://github.com/raspberrypi/picoprobe.git
cd picoprobe
git submodule update --init
# create build dir and switch
mkdir build && cd build
# setup build files
PICO_SDK_PATH=../../pico-sdk cmake ..
# build
make -j4
If everything went well, you see a file called picoprobe.uf2 in your current directory.
Building the pico examples
# navigate back to your pico directory
# clone picoprobe and install submodules
git clone https://github.com/raspberrypi/pico-examples.git
cd pico-examples
# create build folder and navigate
mkdir build && cd build
# setup build files using PICO_SDK_PATH env var and CMAKE_BUILD_TYPE compiler parameter, IMPORTANT!
PICO_SDK_PATH=../pico-sdk cmake -DCMAKE_BUILD_TYPE=Debug ..
# build hello serial:
cd hello_world/serial
make -j4
Make sure you can see a hello_serial.elf file in your current directory.
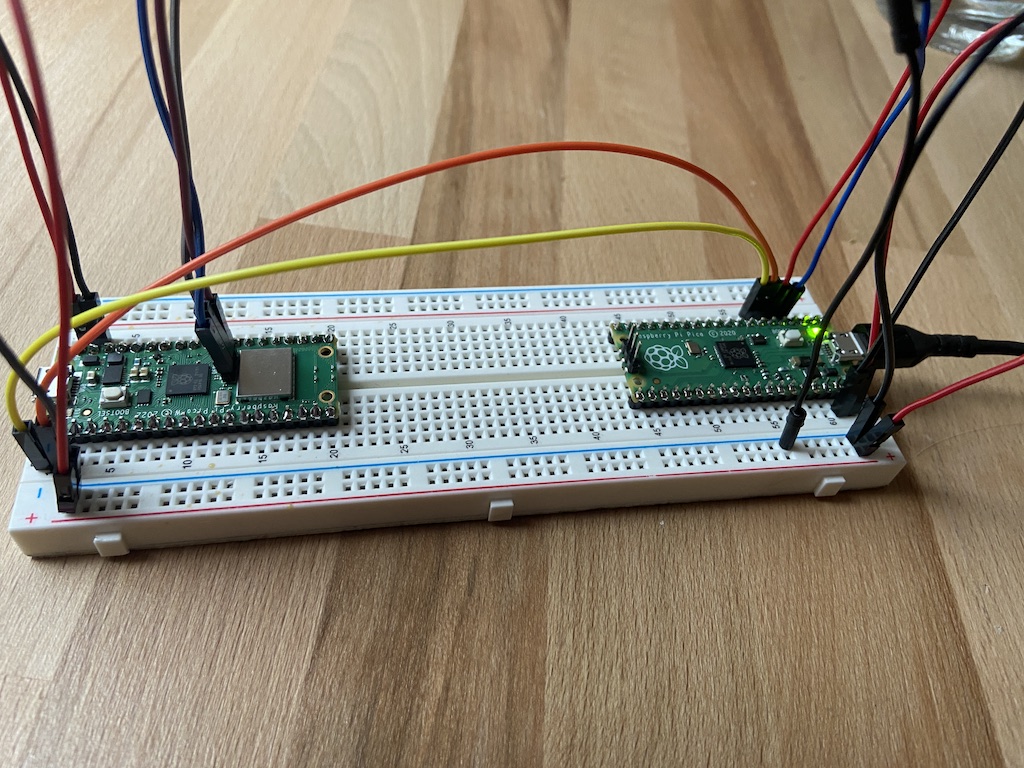
Wiring up the two Picos
Nothing as simple as an image:
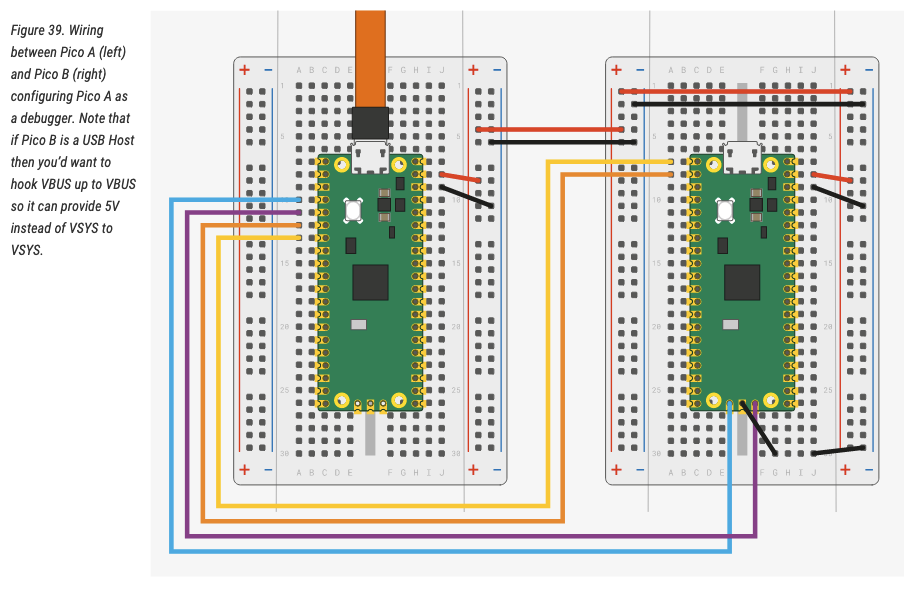 (image taken from the linked Getting Started Document)
The pico on the left using the yellow USB cable is your debugging picoprobe. Yellow and orange are for serial passthrough, teal and purple are for the Debug bus.
Flashing Picoprobe
When attaching a USB Cable to your Picoprobe-Pico, hold down the BOOTSEL button on the board to make the Pico run in bootloader mode. On your mac you should see a external volume popping up with the name RPI-RP2. Copy the picoprobe software over and the device will restart automatically.
cd ~/pico/picoprobe
cp picoprobe.elf /Volumes/RPI-RP2/
Finally, Debugging!
Now, open another terminal [T2] and navigate to ~/pico/openocd. To start the on-chip debugger service, run:
src/openocd -f interface/cmsis-dap.cfg -c "adapter speed 5000" -f target/rp2040.cfg -s tcl
At the end of the output you should read: Listening on port 3333 for gdb connections. Yes? good!
Now, switch back to the terminal which you used to build 3 steps before [T1], and run arm-none-eabi-gdb with the hello_serial.elf build file. This will connect to the on-chip debugger port you just opened and use the hello_serial.elf build for debugging.
arm-none-eabi-gdb -q -ex "target extended-remote :3333" hello_serial.elf
You should be able to see GDB output now.
❯ arm-none-eabi-gdb -q -ex "target extended-remote :3333" hello_serial.elf
Reading symbols from hello_serial.elf...
Remote debugging using :3333
warning: multi-threaded target stopped without sending a thread-id, using first non-exited thread
time_reached (t=...) at /Users/ts/code/pico/pico-sdk/src/rp2_common/hardware_timer/include/hardware/timer.h:116
116	    uint32_t hi_target = (uint32_t)(target >> 32u);
In [T1], tell GDB to load the binary file to the remote pico by writing load into the gdb terminal:
(gdb) load
Loading section .boot2, size 0x100 lma 0x10000000
Loading section .text, size 0x44e8 lma 0x10000100
Loading section .rodata, size 0xfb4 lma 0x100045e8
Loading section .binary_info, size 0x28 lma 0x1000559c
Loading section .data, size 0x244 lma 0x100055c4
Start address 0x100001e8, load size 22536
Transfer rate: 16 KB/sec, 3756 bytes/write.
In the openocd [T2] Terminal you should see this output repeatedly, while the .elf file is loaded to the target chip:
target halted due to debug-request, current mode: Thread
xPSR: 0xf1000000 pc: 0x000000ea msp: 0x20041f00
Okay, perfect, switch back to [T1], and place a breakpoint to hello_serial.c:14:
(gdb) b hello_serial.c:14
Breakpoint 1 at 0x10000310: file /Users/ts/code/pico/pico-examples/hello_world/serial/hello_serial.c, line 14.
Note: automatically using hardware breakpoints for read-only addresses.
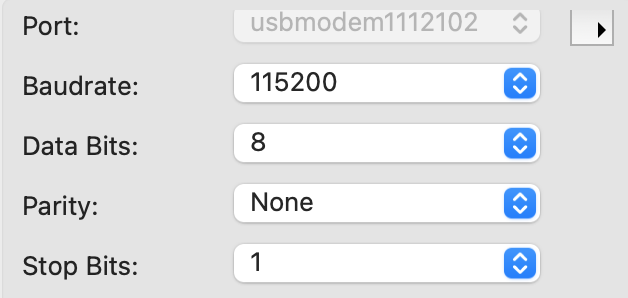
Open your Terminal software, connect to your usb attached picoprobe with settings BAUD 115200 8-N-1:
Switch back to your GDB [T1] and run the software. For this, just type r and press ENTER. GDB will ask you if it should start the software from the beginning. Write yes. Now you should see the following output since you run into a breakpoint:
(gdb) r
The program being debugged has been started already.
Start it from the beginning? (y or n) y
Starting program: /Users/ts/code/pico/pico-examples/hello_world/serial/hello_serial.elf
target halted due to debug-request, current mode: Thread
xPSR: 0x01000000 pc: 0x00000184 msp: 0x20041f00
[New Thread 2]

Thread 1 hit Breakpoint 1, main () at /Users/ts/code/pico/pico-examples/hello_world/serial/hello_serial.c:14
14	        sleep_ms(1000);
In CoolTerm, you should see a Hello World! output. If this is the case, everything worked fine! In case you are not familiar with GDB debugging, I can just recommend this GDB cheat sheet. Some short commands:
rfor RUN the program, ctrl+c to stop the programlto print the code where you currently areb [filename]:[line]to set a breakpointcto continue until the next breakpointnto step to the next instruction
Congrats, you can now do on-chip debugging on a Raspberry Pi Pico by using another Raspberry Pi Pico.